
In my day-to-day role as a data consultant, I have never run across a situation where a single data source answered every question. Many times I work with clients that have two, three or even a dozen different sources of data. It might be various on-premise databases with some cloud data sources and an extraneous Excel document or two. Sometimes there are directories full of PDFs or text files. Occasionally, there’s a JSON or XML feed with valuable data that needs to be captured.
So how do you bring this data together for analysis? How do you compare values across different sources?
I love Tableau and use it on a daily basis to answer data questions and tell data stories. I also have been growing in my knowledge and appreciation for the capabilities of Alteryx. Both tools allow you to combine data from various sources into meaningful structures for deeper analysis. In fact, I’ve recently enjoyed some interaction with the data community around different approaches to shaping data in each tool.
Both Tableau and Alteryx are unique in their approach to data prep, blending and integration. Understanding these differences allows you to leverage the power of each tool.
Tableau Data Tips
Tableau continues to innovate in data preparation, blending and integration. Each new release introduces new features that make life easier for a data analyst. Tableau has three primary ways of bringing disparate data sources together for analysis:
1. Different data sources visualized in a single dashboard.
A Tableau workbook can have as many connections to as many different data sources as you’d like and you can use all of them to create individual visualizations that can be combined seamlessly on a dashboard. Action filters and cross-database filters allow you to create seamless interactivity for the end user.
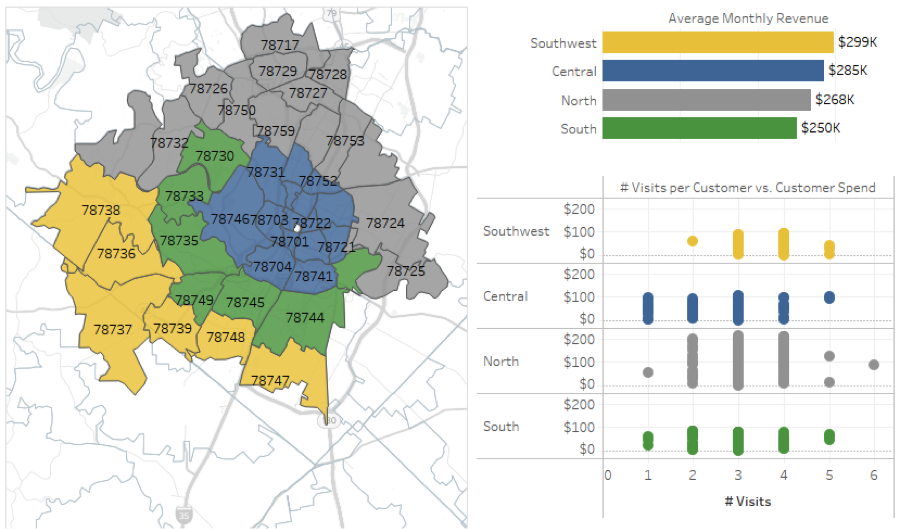
The users will be happy to see financial data from your general ledger system and customer data from your CRM in a single dashboard, your boss will be impressed with how fast you built it, and you’ll smile to yourself as you think about how easy it was to create each connection and bring it all together with a few clicks.
2. Different data sources blended together.
In Tableau, “data blending” is a technical term used to describe using two separate data sources in a single visualization. Unlike joining, which is done row-by-row, data blending is performed at an aggregate level. This innovative approach was introduced way back in Tableau 6 and has been improved since.
Data blending in Tableau gives you the power to do amazing visual analytics with disparate data and offers unique benefits:
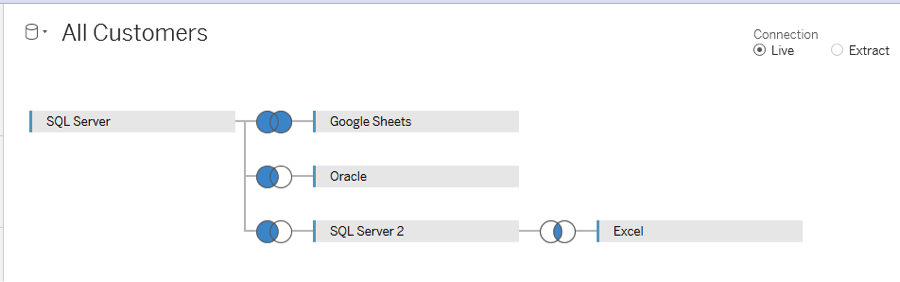
3. Different data sources joined together.
Tableau allows you to join tables from various data sources together to create a single data source that will meet your analytical needs. Do you have customer data stored in a couple of SQL Server and Oracle databases? Do you have supplemental data in Excel and a Google Sheets document that the team updates every day?
No problem! Tableau will let you bring together all of these and more. And with various other data prep tools such as pivot, merge and join calculations, you have tremendous power to shape the data in just the right way for your analysis.
Also, be on the lookout for a new product from Tableau — code-named “Maestro” —which was demoed at Tableau Conference 2016. It takes the concepts that are already built into Tableau Desktop to a whole new level to make data preparation and shaping even easier and more robust.
Alteryx Data Tips
Alteryx offers a slightly different paradigm for bringing various data sources together for analysis. In Alteryx, you build a flow, usually starting with one or more Input Data tools to bring in data from a source such as a text file or database and then, using various other tools like joins, formulas, unions, and filters, you can shape the data with a lot of flexibility.
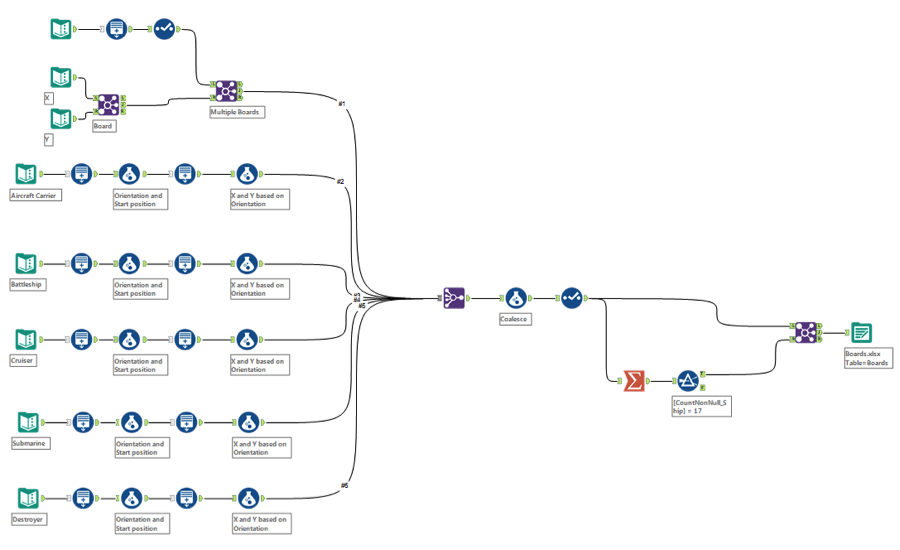
The flexibility of building your own flow allows you to work with complex data sets, thereby having a lot of control over the logic and order of operations. You can generate rows to pad the data with missing dates or other values, you can split the flow to perform logic on a certain subset of data and then you can recombine it into a single output.
Alteryx also allows you to do quite a bit of analysis within the flow and, ultimately, output it for further analysis or visualization in a tool like Tableau. The possibilities for shaping, prepping and integrating various sources of data are almost endless!
Should You Use Tableau or Alteryx
My answer: yes!
But beyond a simplistic answer, you’ll have to understand the paradigm of each platform and understand how each can address your specific data needs. Alteryx gives you a lot of flexibility to blend data from various sources, shape it as needed, perform complex logical operations and perform all kinds of analytics at any step in the flow. Tableau shines when it comes to visual analytics, allowing you to instantly see the answers to your questions and stay in a flow of having a conversation with the data, even when it comes from many different sources. If you want the best of both worlds, use both!
Explore Tableau and Alteryx trainings
Share:
About the Author