There have been two times in my 14 years at Resultant that I have fallen in love with what I do. I mean, I’ve enjoyed all of it. I really liked writing custom software for clients in the early days and moving data around in transactional systems. I liked making web applications. I enjoyed learning data modeling and helping clients solve problems and gain insight into their data by building data warehouses. Some of the early ETL tools were a bit tedious, but it was still a great feeling to populate a useful data structure.
But both Tableau and now Tableau Prep have changed my world and allow me to serve my clients in amazing ways!
Tableau-Love At First Sight
Tableau was the first time I fell in love. A colleague of mine introduced me to Tableau 5.0 and I’ve been hooked ever since. The magic of Tableau is flow: the ability to work as you think, to ask questions and take intuitive actions to get answers, to iterate and dig deeper, and finally to put it together to communicate the story and meaning of the data. From that point on, I never wanted to do anything except visual analytics in Tableau.
But data is messy. I’ve never seen completely clean data set. Never. Furthermore, I rarely have all the data I need or want in a single repository. New and existing features in Tableau such as custom SQL, unions, cross database joins, blending and pivots made it possible to handle many of these cases. And I thought I was content to use these features to get the data structured and cleaned for analysis.
Falling in Love All Over Again
Then, I fell in love again. This time with Tableau Prep. I had the privilege of evaluating Tableau Prep (at that time called Project Maestro) when it was in alpha and beta. The initial UI of the alpha was a bit bare-bones, but after a bit of trial-and-error, the paradigm clicked. I was hooked again!
The magic of Tableau Prep is the same as Tableau: it’s working as a flow of thought and action that is seamless. I can connect to data and then clean it, shape it, and bring it together into a structure that is useful for visual analytics. And it’s all the same drag-and-drop-intuitiveness that I’m used to in Tableau. Best of all, I see the data taking shape before my eyes. The Hyper data engine is working behind the scenes so I can see the data at each step of transformation.
An Example of Tableau Prep’s Amazing Paradigm
Each new beta release of Tableau Prep brought incredible new features that added to the paradigm. I was eager to see what real-world problems I could solve.
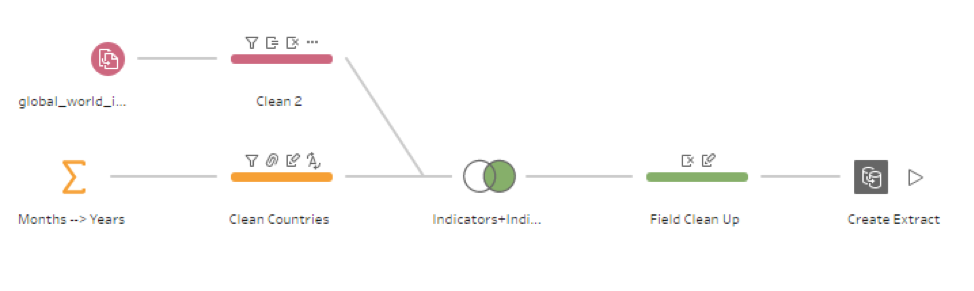
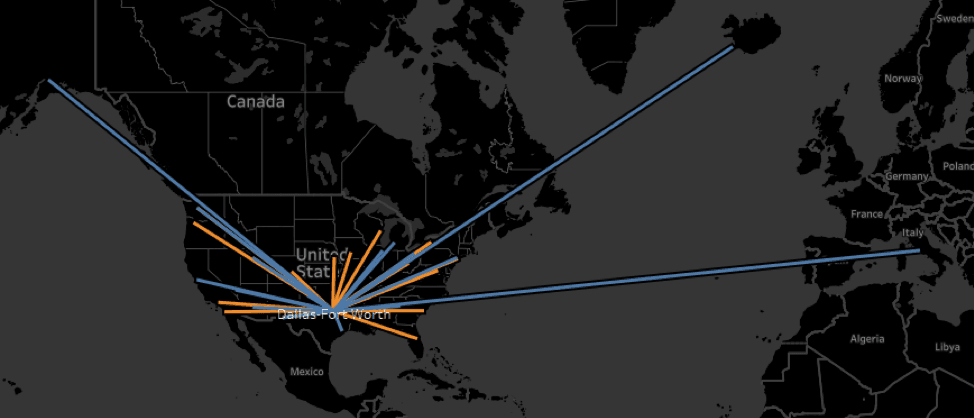
One of my clients at the time presented me with a particular challenge. They wanted to analyze employee air travel to understand where they could find cost-savings and optimization. And they wanted one of those really cool flight path maps. Most of their data was in SQL Server, but some of it was in periodic data dumps. And I knew that I’d have to create a certain structure and add in latitude and longitude to build the flight paths.
Tableau Prep made it incredibly easy! With a few clicks I’d unioned together all the text files and the SQL Server data, cleaned up some mis-matched fields and data values, matched the employees, pivoted and joined to geocoding to get the rows I needed for the flight paths map:
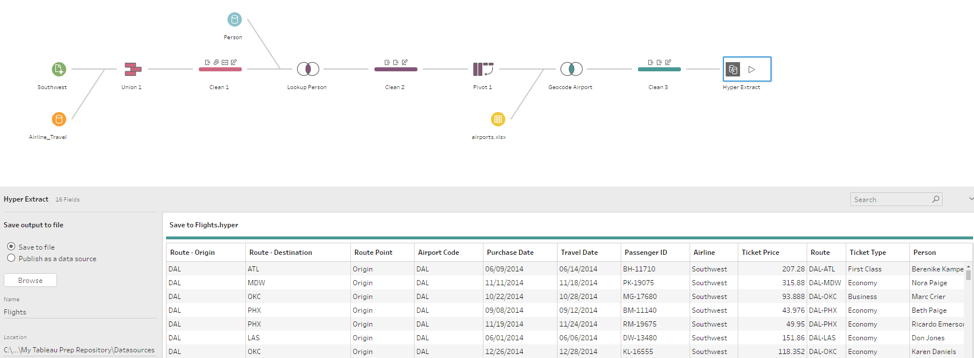
And the end result? A data set that met all the requirements for analyzing employee travel, finding cost savings, and even creating that amazing flight path map:
To download a free trial version of Tableau Prep, click below.
Share:
About the Author