
One of the great frustrations in performing a cluster analysis is determining the correct number of clusters to retain. In their article “Clustering: Science or Art?”, Guyon, von Luxborg, and Williamson argue that “the major obstacle is the difficulty to evaluate a clustering algorithm without taking into account the context.” However, determining the appropriate contextual statistic is sometimes daunting and the data scientist typically leans on the default selection from the software package being deployed. And while an analyst should never depend on the canned recommendations for selecting the correct number of clusters, it is sometimes the case that default determines practice.
The frustration, however, is that there are currently over 30 different methods for determining the correct number of clusters to retain when doing K-means clustering. This difficulty is exacerbated by the fact that selecting the appropriate method requires not only an exhaustive understanding of the optimization procedures for each method, but also a thorough examination of your own data to understand which procedure is appropriate.
More = Better
Determining the correct number of clusters is as much art as science. Therefore, it stands to reason that you can make a better artful decision by having more information. The problem is that compiling all of the information from multiple statistics into a single source can be time consuming and frustrating. With the strength of computing, this task can be automated and a process that might have previously taken a full day (or even two), can now be computed in moments. The idea behind leveraging computing power is to run multiple clustering decision algorithms simultaneously and then produce a table that reveals the number of clusters most frequently chosen by the different procedures.
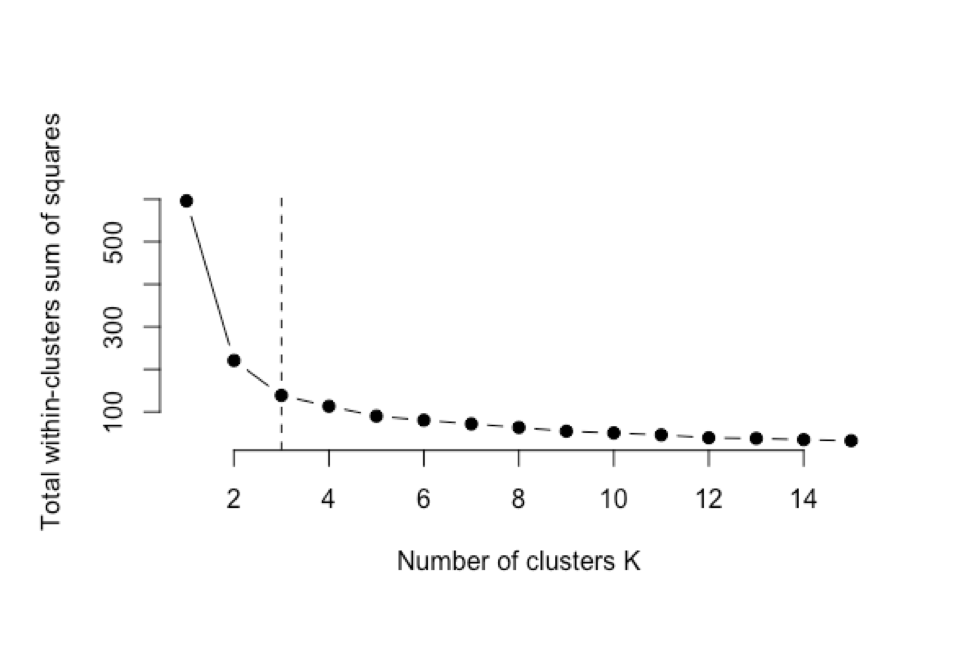
The caution behind this style of analysis is that the analyst is dependent on the algorithm making judgement calls that maybe should be left to the data scientist. For example, when using the “elbow method”, multiple models are run for different cluster sizes and the total within-clusters sum of squares is plotted. The number of clusters retained is based on the elbow of the curve. The “judgement call” part comes when the researcher decides where the “elbow” occurs. In Figure 1, we would probably define this elbow at 3 clusters. However, when you deploy a macro that computes multiple cluster decision algorithms, the analyst is dependent on a computational decision as to where the “elbow” occurs.
Benefits of Utilizing a Clustering Decision Macro
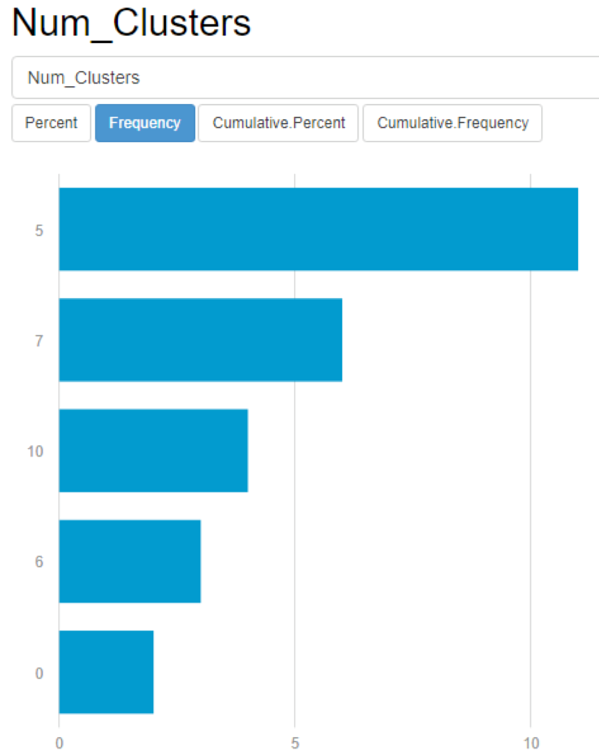
There is confirmation in numbers.
When you run your data through a macro, it is encouraging when you have results that point to a clear data structure (meaning that one solution rises up to the top). This gives the data scientist great confidence in the strength of a cluster count solution (see below).
Minimize the risk of making a clustering decision that is less generalizable.
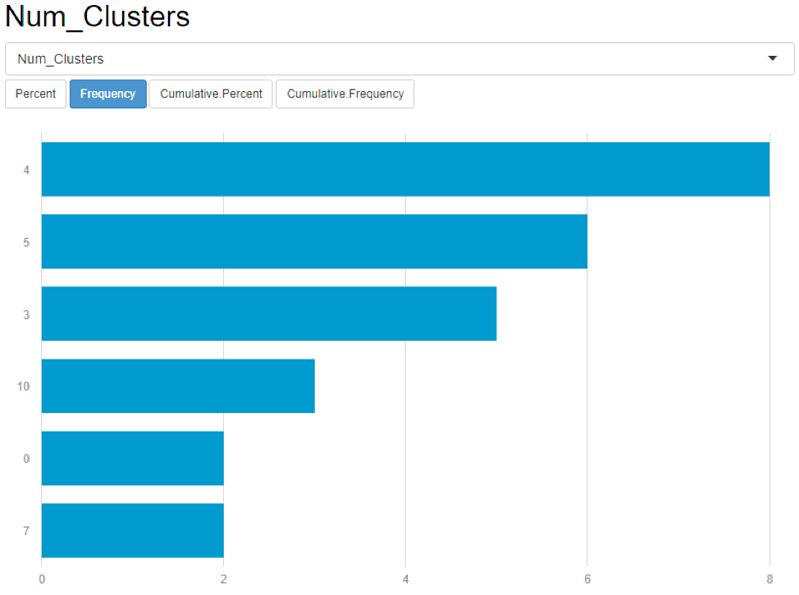
Conversely, when you have multiple cluster counts that are near each other (like the example in the figure below), you are able to apply more interpretation to your data and select the number of clusters that would be more empirically plausible. Results like the one below might also indicate that the variables used to cluster are not good selections for clustering and a new variable set should be considered.
Consider multiple variable sets quickly for determining data clustering.
As illustrated in Figure 3, the results of your initial run may indicate a bad variable set choice. When this is the case, you can quickly run multiple variable sets to determine a good selection set to determine clustering.
How Do I Put This to Work?
Both Alteryx and R are powerful tools for processing complex algorithms into your operational workflows. Even more powerful is integrating the two by running a macro that allows for simultaneous analysis and visualization (e.g., using the R routine NbClust inside Alteryx and then pushing the results into Tableau to help make modeling decisions).
If you would like more information about how to run an analysis like this, reach out to our team today.
Share: