
When I was a professor of quantitative methods, I made a deal with my students. They never said something is “significant” and I didn’t throw an eraser in their general direction.
From Day 1, I made it clear that the intolerable intellectual faux pas in quantitative analysis is not specifying which type of significance you were reporting. And lest they would think there were only a couple of types, I would have them read Leach and Onwuegbuzie 2004; (Link To Article) to illustrate that there are now four different ways in which we can discuss significance: statistical, practical, clinical, and economic.
This is such a hot button that the American Psychological Association included language in the 5th edition of the APA Manual which stated that all research in which a statistical test was performed should also include a measure of practical significance (e.g., effect size).
So, is conducting a statistical test and calling the result “significant” such an egregious sin that we needed to update the APA Manual to encourage researchers to stop using this word as some sort of dangling modifier?
In short, “Yes!” Let me illustrate.
Just What is a P-Value, Anyway?
If you harken back to your “Introductory Stats” days, you might remember discussions of null hypotheses and whether or not to reject them (recall that we would never “accept” a null hypothesis and that language like that would leave you ducking from more than a few erasers). The resulting decision of whether or not one should reject or fail to reject the null was governed by an investigation of the p-value. The idea for the p-value was postulated by William Gosset writing under the pseudonym “Student”. Gosset, an employee of Guinness (yes, that Guinness), was trying to come up with a way to monitor the consistency of beer between batches. His discoveries led to “Student’s t-test”, which then led to the birth of the p-value.
In short, the p-value was a single metric indicating “I found something” in a statistical test. In terms of the t-test, finding a p-value below some threshold (say 0.05) meant that one batch of brew was statistically significantly different from the others, and that batch should be tossed.
Pregnant vs. Failing to be Pregnant
Another similar faux pas commonly occurs when studies report results as “really significant” by proxy of how small the p-value is in a test. The p-value does not give us a strength of association between variables. It should be interpreted in the same way you interpret a pregnancy test: you either are or you are not. Women who are 8 months into their pregnancy are not “more pregnant” than women who are 1 month along. Yes, the size of the child is noticeably different (think of this as an effect size), but both women are pregnant (think of this statistically significant).
Let’s illustrate why it would be wrong to interpret a small p-value as “more significant” with the following two examples.
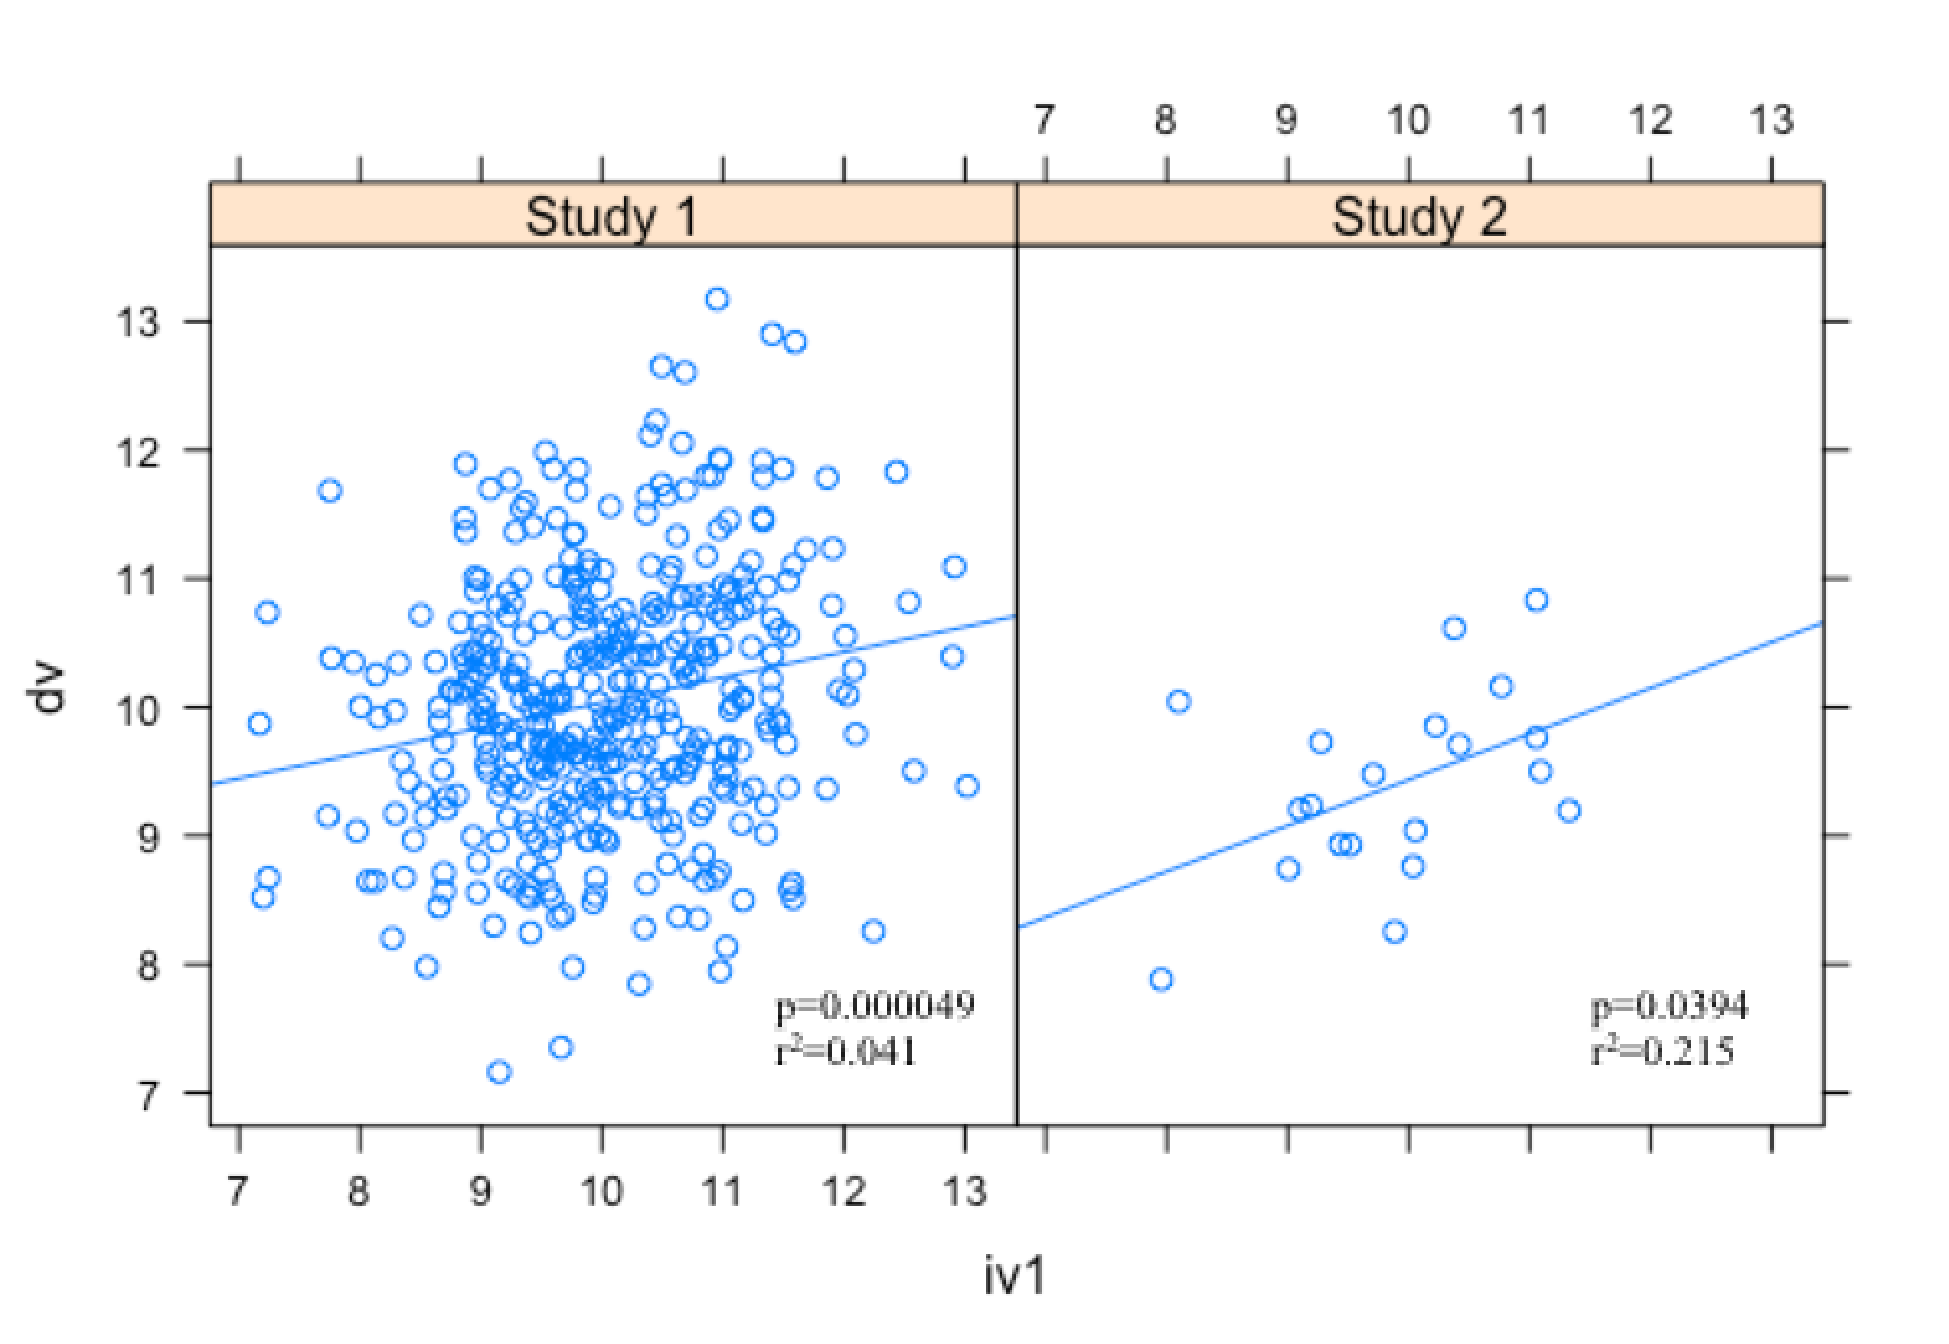
If we subscribe to the “smaller p-values are better” camp, we might conclude that Study 1 has better results. But in truth both studies are statistically significant, or “pregnant” (if we hold to an a= 0.05 criteria). The difference in the two is in the r2, or effect size. Although Study 1 has the smaller p-value, Study 2’s effect is almost 5 times the effect in Study 1. Therefore, it would be more advisable to prefer the results from Study 2 over Study 1, even though the p-value for Study 2 is much closer to 0.05.
The Almighty 0.05
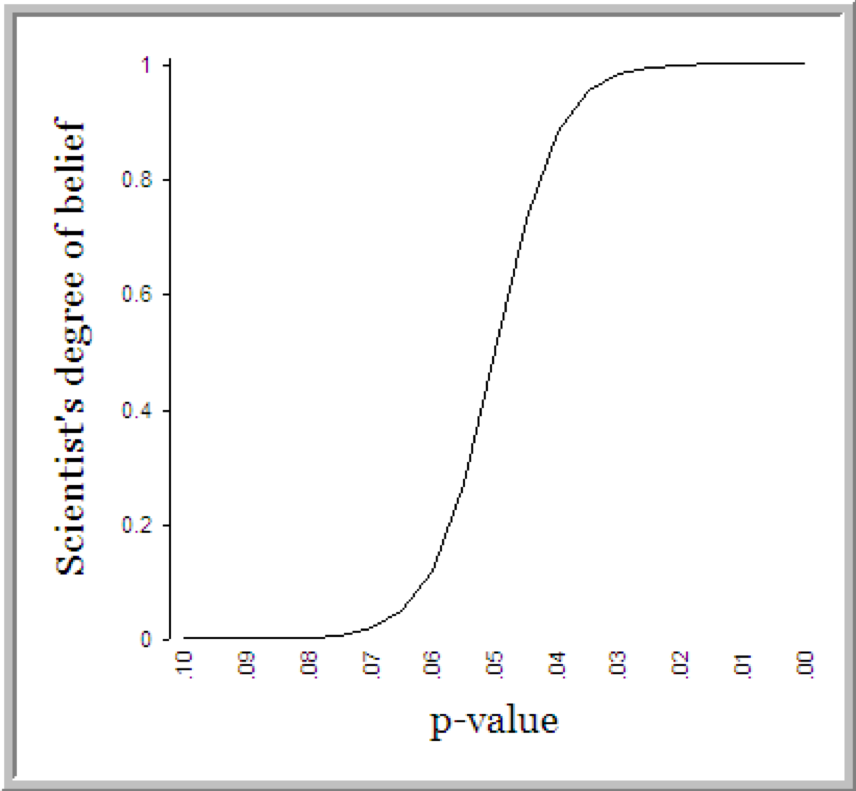
Dan Goldstein made the mocking graph below when discussing the arbitrary nature by which scientists determine whether or not a result is meaningful. Rosnow and Rosenthal even jibbed, “surely, God loves the .06 nearly as much as the .05” when arguing that “dichotomous significance testing has no ontological basis” (p. 1277). Their caution is well heeded: Researchers will weigh the outcome of a study on a single statistic whose sole criteria for meaningfulness is a whether or not they are below some arbitrary threshold.
In a world where data scientists are now analyzing big data with unreal levels of observation, the probability of obtaining a statistically significant result is surprisingly easy. Consider that a correlation of 0.02 is statistically significant (p=0.036) in the presence of 20000 observations (results from a quick simulation in R). The theoretical problem that Rosnow and Rosenthal prophetically observed back in 1989 is now being encountered on a daily basis in the realm of machine learning. Obtaining statistically significant results might merely be a byproduct of the fact that you are analyzing a massive sample. Proceed with caution.
Suggested Reading
Cohen, J. (1994). The earth is round (p<.05). American Psychologist, 49, 997-1003. Link To Article
Gelman, A. & Stern, H. (2006). The Difference Between “Significant” and “Not Significant” is not Itself Statistically Significant. The American Statistician, 60, 328-331. Link To Article
Rosnow, R.L. & Rosenthal, R. (1989). Statistical procedures and the justification of knowledge in psychological science. American Psychologist, 44, 1276-1284. Link To Article
Share:
About the Author